x64 Application Debugging: Edit and Continue not allowed, but you need a Stopwatch
This article was originally published for www.prowareness.com and could be located at http://www.prowareness.com/blog/x64-application-debugging-edit-and-continue-not-allowed-but-you-need-a-stopwatch/.
Here’s a scenario. You are debugging some 64 bit code to improve performance, say it’s a pretty long running method with a bunch of IO operations and conditional loops, something like shown in Listing 1. You have started a debugging session or attached a running process to your solution, and when you try to Edit the code to insert a Stopwatch, you’d get the error message: Changes to 64-bit applications are not allowed. This feature to Edit the code and continue debugging for a 64 bit application is not supported by CLR (though a recent version supports it). You might try changing the project’s target platform temporarily to Any CPU or x86, but let’s say you are debugging a huge project, and in order to get to the code snippet where you want to put a Stopwatch, it takes half an hour or you just don’t want to re-enter a new debugging session because you have a good retrospective and trace in the current debugging session.
            viewModel.FunctionList = functionManager.ListAll();

            foreach (var item in viewModel.FunctionList)
            {
                item.FunctionName = MultiLingualHelper.GetCustomerText(item.FunctionName, item.FunctionName, "CDT");
            }

            viewModel.TeamList = teamManager.ListAll();

            foreach (var item in viewModel.TeamList)
            {
                item.TeamName = MultiLingualHelper.GetCustomerText(item.TeamName, item.TeamName, "RMOCDT");
            }

            viewModel.DepartmentManagerList = departmentManager.ListAll();

            foreach (var item in viewModel.DepartmentManagerList)
            {
                item.DepartmentName = MultiLingualHelper.GetCustomerOrSystemText(item.DepartmentName, item.DepartmentName, "RPDCDT");
            }
Listing 1
How would you put a Stopwatch to measure what time a snippet takes in the middle of an x64 debugging session?
Okay it could be done in 2 or 3 very simple steps, I will describe them one by one.
-
You could set and query properties, fields and methods of an object via the Immediate Window; but you could also create a new object for the current debugging session via the Immediate Window.
-
You could query a property or a field via a Watch Window; but you could also call some methods via the Watch Window.
-
You could break at a breakpoint; but you could also access properties or an object field when a breakpoint is hit.
Point 3, might be optional, but you may like to use it. Anyways that’s the gist, let’s see them in action.
Listing 2 shows a typical Stopwatch code when you want to measure the time took to execute the method FooBar(). We will have to separate the initialization to be a part of the Immediate Window, and all other method, property calls to be a part of the Watch window.
            var sw = new System.Diagnostics.Stopwatch();
            sw.Start();
            FooBar();
            sw.Stop();
            MessageBox.Show(string.Format("FooBar() took {0} seconds to run.", sw.ElapsedMilliseconds / 1000));
Listing 2
#1. Create a Stopwatch object named stopWatch1 inside Immediate Window. Just one line, and hit Enter.
Fig 2
var stopWatch1 = new System.Diagnostics.Stopwatch();
Listing 3
#2. Now, that our stopWatch1 is created, let’s pull up a Watch Window, and try to access the commonly used properties and methods. Couple of lines below, copy and paste or type them in.
stopWatch1.Reset();
stopWatch1.Start();
stopWatch1.Stop();
stopWatch1.ElapsedMilliseconds
stopWatch1.ElapsedMilliseconds/1000
Listing 4
You are pretty much done here if you are just stepping through the code via F11 or F10, all you should do is, before entering the code region that you want to profile, call the stopWatch1.Start() via the Watch Window – Hit the green refresh icon, and soon as you have started the stopWatch1, continue stepping through or steping over, or continue execution to another breakpoint; but once the critical code is executed, you should go back to the Watch Window, and call the stopWatch1.Stop() method (i.e. Hit the green refresh Icon next to stopWatch1.Stop()). After you have stopped the stopwatch, the values for ElapsedMilliseconds would be refreshed automatically, if not, hit the green refresh icon next to it.
Fig 4
That’s how I did it first, and then I thought about breakpoint options, came up with Point 3.
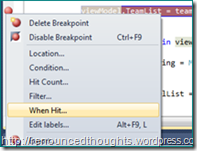
#3. Create a break point (we will call this, breakpointX), after the critical region (or the code snippet whose time you want to measure). Right click on breakpointX, and select When Hit…
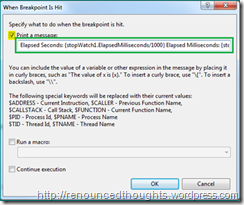
Make sure Print a message: is checked and Continue execution is unchecked.
Fig 6
In the Print a message: text box, type in the below code.
Elapsed Seconds: {stopWatch1.ElapsedMilliseconds/1000} Elapsed Milliseconds: {stopWatch1.ElapsedMilliseconds}
Listing 5
Now once this breakpointX is hit, a message will be printed to the Output Window.
That’s how you do it. Or to say the least, that’s how I figured to do it. If there are better options, please let me know. In my next post, I will show you how to play a sound when a Breakpoint is hit.


[…] previous post showed you how you could put a Stopwatch while debugging an x64 application in visual studio, now […]
Play a sound when a breakpoint is hit in Visual Studio | Computers, Programming, Technology, Music, Literature
July 23, 2013 at 9:14 pm